

Financial Market Fragility
Kamakura Troubled Company Index Decreases by 0.07% to 8.46%
Credit Quality Remains at the 95th Percentile
NEW YORK, November 7, 2022: The Federal Reserve increased rates by 75 basis points and said it is not yet done with its tightening cycle. The comments also noted that the peak federal funds rate may be higher than initially expected. Fed Chairman Jerome Powell has morphed into an inflation hawk. That raises the question as to whether the bank will overtighten in reaction to its earlier inaction and inability to recognize the inflation risks that Covid and post-Covid policies posed. Housing has slowed quickly, but demand and activity have yet to slow in other areas.
During this period of transition–which includes not only rates, but adjustments in global trade, energy dynamics, foreign exchange rates and politics–the markets are likely to show a great deal of fragility. The risk is growing that a localized credit event could trigger a more systemic market reaction. South Korea is a case in point, with its local bond market conditions worsening after the Legoland theme park developer defaulted and Heungkuk Life decided to postpone the redemption of a dollar perpetual bond. South Korea’s offshore bonds have also seen yield premiums widen significantly. The Bank of Korea intervened, trying to stabilize credit markets. Half a world away, the Bank of England intervened in the markets in early October to prevent risks of a contagion in credit markets.
Credit conditions remained at the 95th percentile of the period from 1990 to the present, although expected future defaults are moving up. The 100th percentile indicates the best credit conditions during that period. The Kamakura Troubled Company Index closed October at 8.46%, compared to 8.53% the month before. The index measures the percentage of 41,500 public firms worldwide with an annualized one-month default probability over 1%. An increase in the index reflects declining credit quality, while a decrease reflects improving credit quality.
At the end of October, the percentage of companies with a default probability between 1% and 5% was 6.43%. The percentage with a default probability between 5% and 10% was 1.10%. Those with a default probability between 10% and 20% amounted to 0.63% of the total; those with a default probability of over 20% amounted to 0.30%. Short-term default probabilities ranged from a low of 8.31% on October 27 to a high of 8.88% on October 27, 2022.
Figure 1: Troubled Company Index — October 31, 2022

At the end of October, 15 of the riskiest rated public firms worldwide were in the United States, with two each in Luxembourg and the United Kingdom and one in Germany. The riskiest rated firm remained Loyalty Ventures Inc. (LYLT:NASDAQ), with a one-month KDP of 49.07%, up 11.50% from the previous month. Despite the good overall credit quality globally, there were six defaults in the KRIS coverage universe in October, with three in Canada and one each in the Poland, Taiwan, and the United States. Year to date there have been 24 defaults among rated firms in our coverage universe.
Table 1: Riskiest Rated Companies Based on 1-Month KDP – October 31, 2022

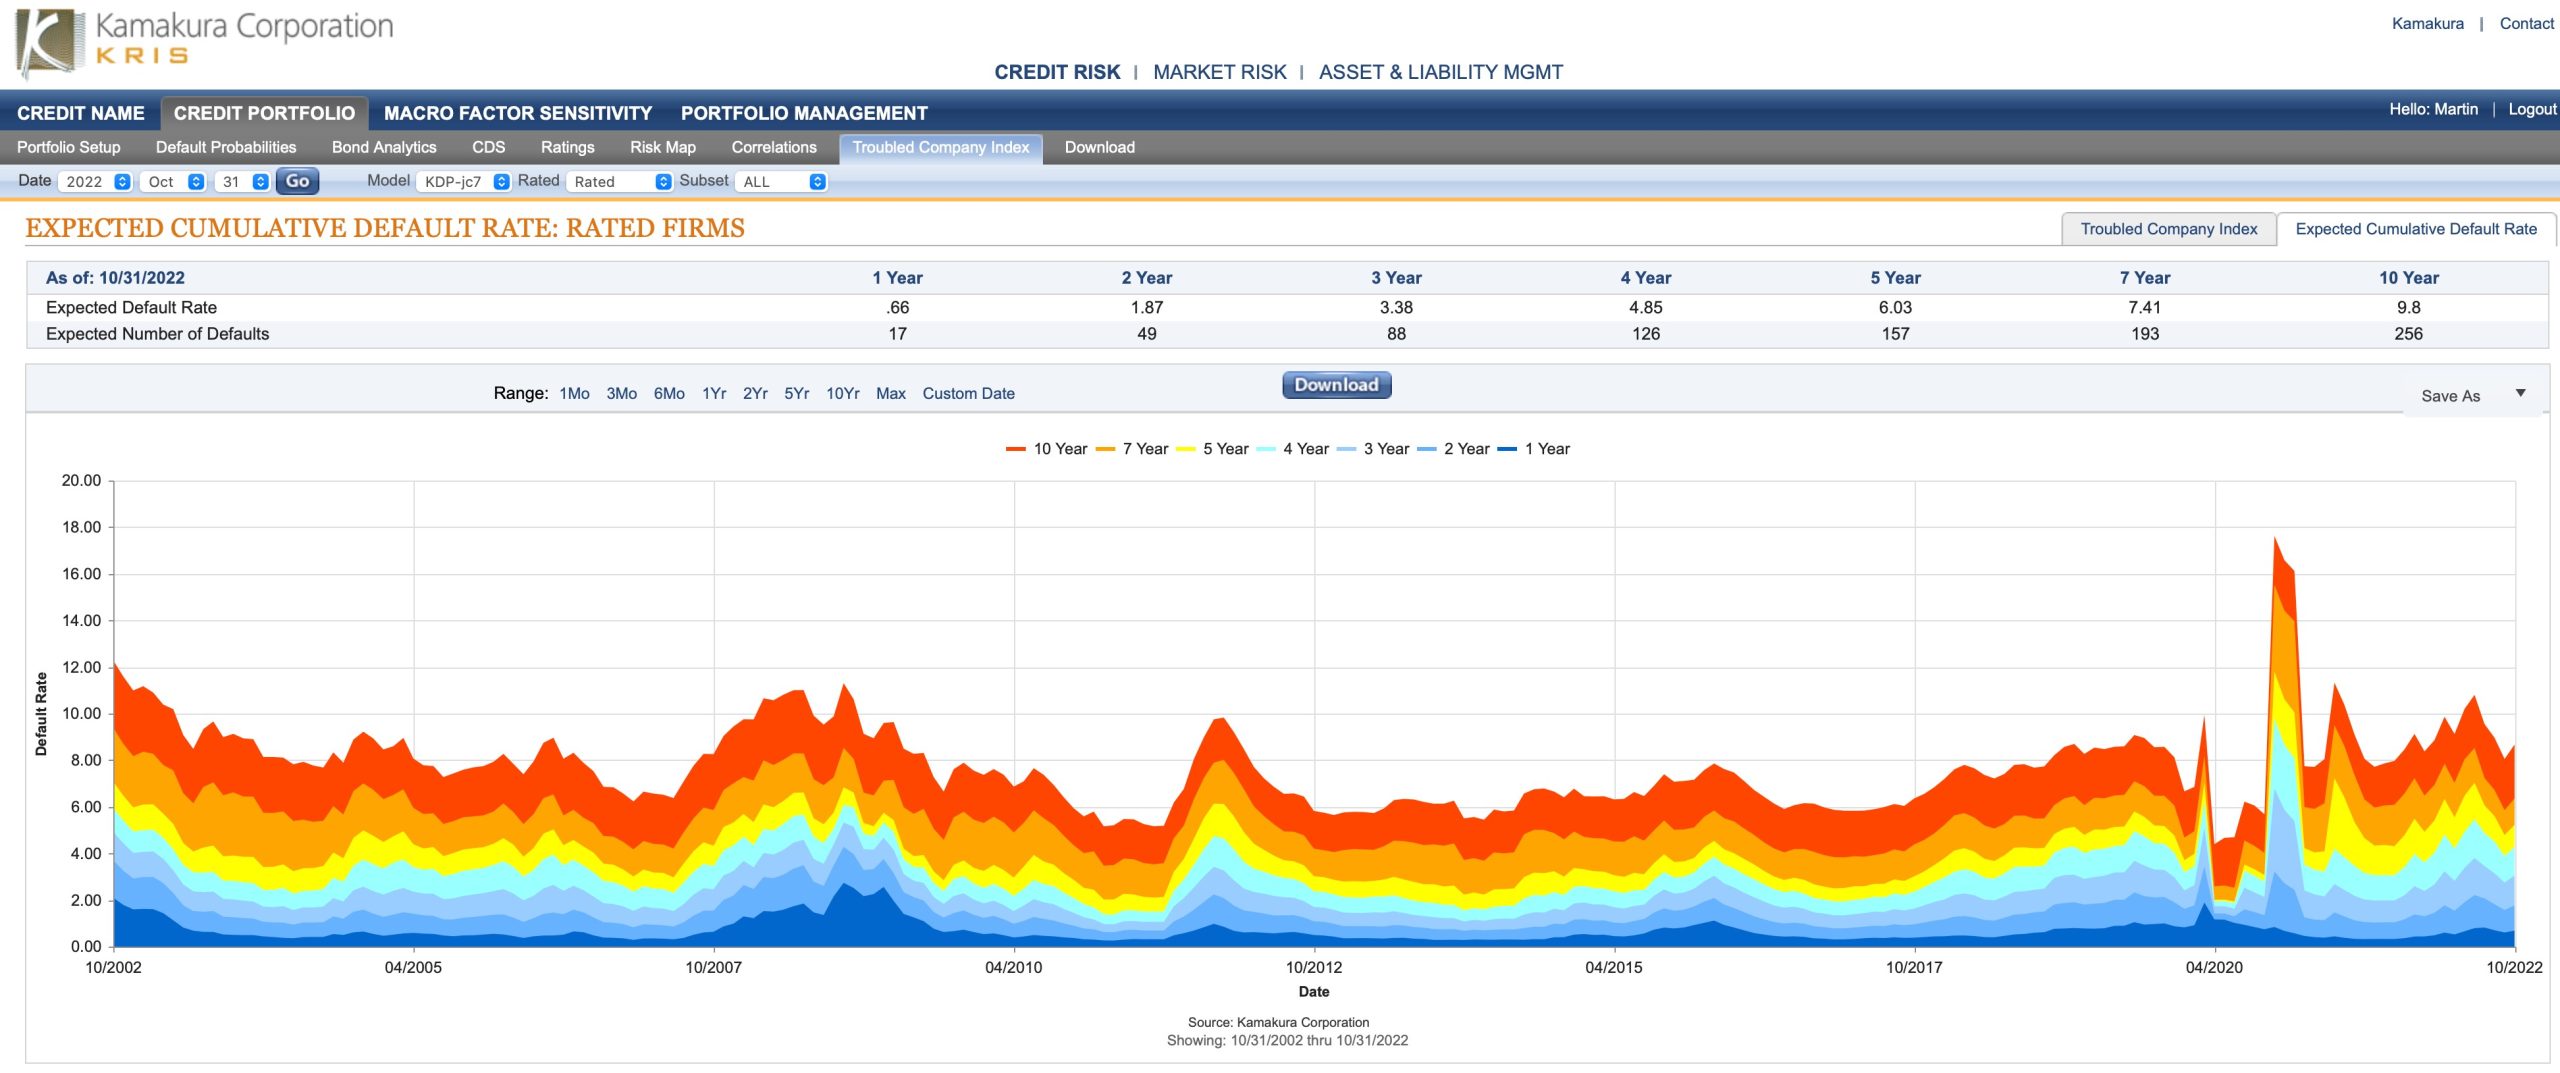
The Kamakura Expected Cumulative Default Rate, the only daily index of credit quality of rated firms worldwide, shows the one-year rate down 0.01% at 0.66%, and the 10-year rate up 1.54% at 9.82%. The 3-year expected cumulative default rate is 3.38% compared to 2.95% last month and 2.69% at the beginning of the year. Note that the 10-year expected cumulative default rate in November, 2008–at the height of the Great Financial Crisis–was 11.44%. Since July 2022, the Expected Cumulative Default Rate has also been reported using the KRIS Version 7.0 default models.
Figure 2: Expected Cumulative Default Rate — October 31, 2022
Commentary
Stas Melnikov and Martin Zorn
SAS Institute Inc.
During October the market saw interventions by the Bank of England and the Bank of Korea to stabilize credit markets. The 10-2 year Treasury spread reached new extremes in inversion not seen since the early 1980s, a time when the Fed was also tightening to fight inflation. The pace of interest rate increases so far has been very rapid compared to previous rate cycles. In addition to the 10-2 spread, another closely watched measure is the 10-year – 3-month Treasury curve, which dipped below zero in October. Yet another key indicator for the Fed is the so-called near-term forward spread, which is the difference between the expected yield curve of a 3-month Treasury bill in 18 months’ time and the yield of the current 3-month Treasury bill. This ratio has declined sharply, but has not yet inverted.
Central banks globally have been following the lead of the Federal Reserve. The 10 central banks overseeing the most heavily traded currencies have increased rates at the fastest pace in at least two decades. A number of their officials have made dovish comments, which may imply that the pace of tightening has peaked. Economic numbers and future actions and comments from the central banks will provide more insight on that score. However, what is becoming very clear is that markets have become more fragile, and unexpected outcomes in hedging, mark-to market movements, defaults or liquidity could quickly trigger a contagion.
Ronald Reagan famously declared, “Trust but verify.” While the central banks have been quick to intervene to prevent localized issues from becoming a global contagion, investors and portfolio managers need to have their own game plans for protecting their positions or unwinding them quickly if market conditions require. Earlier we noted the increase in the expected cumulative default rate for three years as a proxy for a timeframe over which we could see a contraction as a result of the current tightening cycle. What is clear is that the future expected default forecasts have shown higher future defaults as we have progressed through the year. Our data also shows that the three-year expected losses in Europe and Latin America have been trending higher at a faster pace than those in Asia and North America.
Given the increased fragility in the markets–and especially the policy-driven liquidity risks–it could be very difficult to sell or hedge in a sudden downturn. Even unrelated news could trigger losses in portfolios and cause a fire sale, at a time when rising rates and the strong dollar are putting tremendous pressure on sovereign debt. The IMF issued its own warnings in a recent blog based on the October 2022 Global Financial Stability Report, “Financial Stability in the New High-Inflation Environment.” Portfolio managers would do well to heed them.
About the Troubled Company Index
The Kamakura Troubled Company Index® measures the percentage of 41,500 public firms in 76 countries that have an annualized one-month default risk of over one percent. The average index value since January 1990 is 14.40%. Since July 2022, the Kamakura index has used the annualized one-month default probability produced by the KRIS version 7.0 Jarrow-Chava reduced form default probability model, a formula that bases default predictions on a sophisticated combination of financial ratios, stock price history, and macro-economic factors.
The KRIS version 7.0 models were developed using a data base of more than 4 million observations and more than 4,000 corporate failures. A complete technical guide, including full model test results and key parameters, is provided to subscribers. The KRIS service also includes a wide array of other default probability models that can be seamlessly loaded into Kamakura’s state-of-the-art enterprise risk management software engine, Kamakura Risk Manager. Available models include the non-public-firm default model, the U.S. bank model, and the sovereign model. Related data includes market-implied credit spreads and prices on all traded corporate bonds traded in the U.S. market. Macro factor parameter subscriptions include Heath, Jarrow, and Morton term structure models for government securities yields in Australia, Canada, France, Germany, Italy, Japan, Russia, Singapore, Spain, Sweden, Thailand, the United Kingdom, and the United States, plus a 13-country “World” model. All parameters are derived in a no-arbitrage manner consistent with seminal papers by Heath, Jarrow, and Morton, as well as Amin and Jarrow. A KRIS Macro Factor Scenario Service subscription includes both risk neutral and “real world” empirical scenarios for interest rates and macro factors.
The version 7.0 model was estimated over the period from 1990, through the Great Recession and ending in February 2022. The 76 countries currently covered by the index are Argentina, Australia, Austria, Bahrain, Bangladesh, Belgium, Belize, Botswana, Brazil, Bulgaria, Canada, Chile, China, Colombia, Croatia, Cyprus, Czech Republic, Denmark, Egypt, Estonia, Finland, France, Germany, Ghana, Greece, Hungary, Hong Kong, Iceland, India, Indonesia, Ireland, Israel, Italy, Japan, Jordan, Kenya, Kuwait, Luxembourg, Malaysia, Malta, Mauritius, Mexico, Nigeria, the Netherlands, New Zealand, Norway, Oman, Pakistan, Peru, the Philippines, Poland, Portugal, Qatar, Romania, Russia, Saudi Arabia, Serbia, Singapore, Slovakia, Slovenia, South Africa, South Korea, Spain, Sri Lanka, Sweden, Switzerland, Tanzania, Taiwan, Thailand, Turkey, the United Arab Emirates, Uganda, the UK, the U.S., Vietnam and Zimbabwe.
About SAS
SAS is the leader in analytics. Through innovative software and services, SAS empowers and inspires customers around the world to transform data into intelligence. SAS gives you THE POWER TO KNOW®.
Editorial contacts:
- Martin Zorn – Martin.Zorn@sas.com
- Stas Melnikov – Stas.Melnikov@sas.com

The acquisition of Kamakura will deepen SAS’ risk solutions portfolio and enable it to serve new facets of the financial services sector.