

NEW YORK: April 2, 2025: U.S. markets were volatile in the first quarter, with investors concerned about tariffs, inflation, interest rates, economic growth, and global tensions. The S&P 500 hit three all-time highs but ended up posting its worst quarterly loss since 2002. Global equities generally fared well by comparison.
What does all this mean in terms of risk? Our favorite risk metric is the change in 3-year default probability by sector. More specifically, we turn our attention to changes since the beginning of the year, in order to capture the impact of policy changes on default risk. As shown in Table 1, the median change by sector has been generally benign, with the largest risks concentrated in energy, telecommunications, and health care. However, we should note that the energy sector often provides an early warning of economic softening.
Table 1: Change in 3-Year Median Default Probability by Sector – December 31, 2024 – March 30,2025

Source: SAS Institute KRIS data service
This month we take a closer look at U.S. housing sector risks. While many expenditures are discretionary, spending on housing, like food, is a necessity regardless of economic conditions. Housing also represents approximately 15-18% of the U.S. GDP as measured by residential investment and consumption of services, including rent and utilities.
Housing contributes to the economy in several ways. Construction provides a direct economic stimulus in the form of salaries; the consumption of materials and goods such as lumber, steel, and appliances; and the delivery of services, such as plumbing, electrical work, and landscaping. Government policies on tariffs and immigration, as well as inflation and interest rates, all have a direct impact on the construction sector.
Housing is also an important source of wealth creation. In the U.S., home values represent an estimated 30% to40% of total household worth. Not surprisingly, property values have a strong impact on consumer sentiment, especially for the middle class, where home value is the primary asset.
Affordable housing has become increasingly challenging across the U.S., especially in high-cost urban areas, where many multi-family units are now occupied by those who rent by necessity, as well as those who do so by choice. There are also sharp demographic differences, with home ownership being more common among baby boomers and GenXers, while many younger millennials and Gen Zers are delaying home purchases in order to manage student loan debt and rising living costs. The age of new household formation has increased, in part because young families are less able to buy homes early in their careers.
Still, millennials have begun streaming into the housing market since about 2020, partly because their financial condition has finally improved after getting a rocky start during the Great Recession—but more often simply because of family formation. This bulging demographic is expected to drive home ownership demand for the next decade. Their selection of home location and amenities will depend to a large extent on office policies governing remote, hybrid, and in-person work—and on their own efforts to balance career and family demands.
Keeping a close eye on housing trends is crucial for portfolio managers, not only because housing is a consumer necessity, but because it impacts such a wide swath of financing and investments. Especially important factors to monitor are mortgage delinquencies and rental vacancies.
Delinquency rates on single family mortgages have remained low, and rental vacancy rates have been stable, in the 6% to7% range. To examine default probabilities, we look at two segments: homebuilders and multi-family REITs. We expect the homebuilding sector to become more volatile in the near future, since building costs will likely rise as a result of tariffs, and immigrant workers–a significant contributor to the construction trade—are likely to become more scarce as controls are enforced. Affordability challenges and a decline in construction are lowering the supply of economical rental units and increasing demand. We do not see much change in the KDPs since year-end, in line with the global sector analysis. We do see that the homebuilding group is riskier than multifamily REITs, which are very low-risk on both an absolute and a relative basis. These are just some of many insights the KRIS® default probabilities provide for measuring the relative impacts of sector and portfolio financial distress.
Table 2: U.S. Homebuilders and Multifamily REITs: Change in 3-Year Median Default Probability, December 31, 2004 – March 30, 2025

Contemporaneous Credit Conditions
The Kamakura Troubled Company Index® closed the month at 8.68%, up 0.21% from the prior month. The index measures the percentage of 42,500 public firms worldwide with an annualized one-month default probability of over 1%. An increase in the index reflects declining credit quality, while a decrease reflects improving credit quality.
At the end of March, the percentage of companies with a default probability between 1% and 5% was 6.39%. The percentage with a default probability between 5% and 10% was 1.16%. Those with a default probability between 10% and 20% amounted to 0.82% of the total; and those with a default probability of over 20% amounted to 0.31%. For the month, short-term default probabilities ranged from a low of 8.03% on March 24 to a high of 8.84% on March 4.
Figure 1: Troubled Company Index®, March 31, 2025

At the end of March, the riskiest 1% of rated public firms within the coverage universe as measured by 1-month default probability included nine companies in the U.S. and one each in Canada, France and Luxembourg. QVC Group, Inc (NASDAQ:QVC) was the riskiest rated firm in our universe, with a 1-month KDP of 41.26%–up 22.98% over the past month.
Table 3: Riskiest Rated Companies Based on 1-month KDP, March 31, 2025

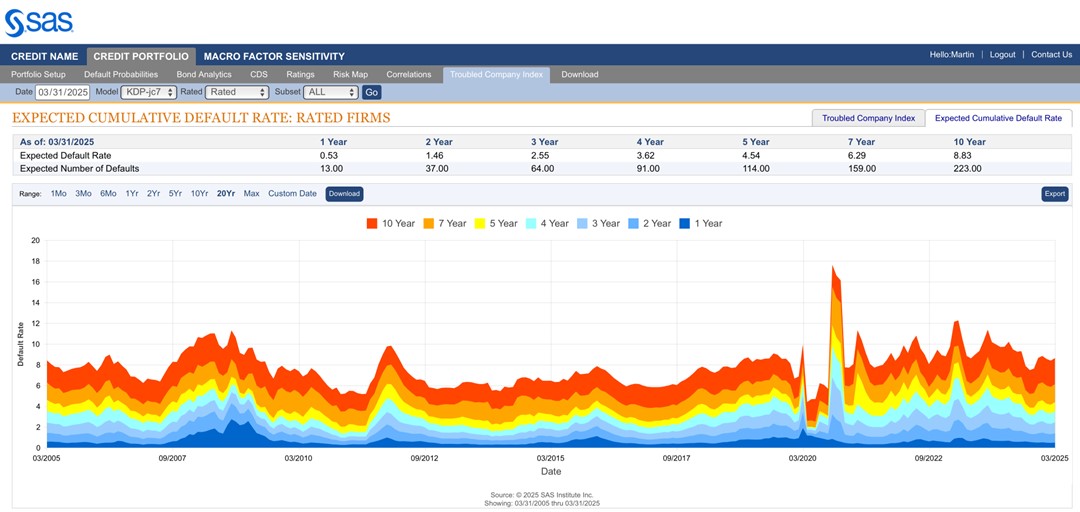
The Expected Cumulative Default Rate, the only daily index of credit quality of rated firms worldwide, shows the one-year rate of 0.53% up 0.03% from the prior month, with the 10-year rate up 0.25% at 8.83%.
Figure 2: Expected Cumulative Default Rates, March 31, 2025
About the Troubled Company Index
The Kamakura Troubled Company Index® measures the percentage of 42,500 public firms in 76 countries that have an annualized one-month default risk of over one percent. The average index value since January 1990 is 14.01%. Since July 2022, the index has used the annualized one-month default probability produced by the KRIS version 7.0 Jarrow-Chava reduced form default probability model, a formula that bases default predictions on a sophisticated combination of financial ratios, stock price history, and macro-economic factors.
The KRIS version 7.0 models were developed using a data base of more than 4 million observations and more than 4,000 corporate failures. A complete technical guide, including full model test results and key parameters, is provided to subscribers. Available models include the non-public-firm default model, the U.S. bank model, and the sovereign model.
The version 7.0 model was estimated over the period from 1990, through the Great Recession and ending in February 2022. The 76 countries currently covered by the index are Argentina, Australia, Austria, Bahrain, Bangladesh, Belgium, Belize, Botswana, Brazil, Bulgaria, Canada, Chile, China, Colombia, Croatia, Cyprus, Czech Republic, Denmark, Egypt, Estonia, Finland, France, Germany, Ghana, Greece, Hungary, Hong Kong, Iceland, India, Indonesia, Ireland, Israel, Italy, Japan, Jordan, Kenya, Kuwait, Luxembourg, Malaysia, Malta, Mauritius, Mexico, Nigeria, the Netherlands, New Zealand, Norway, Oman, Pakistan, Peru, the Philippines, Poland, Portugal, Qatar, Romania, Russia, Saudi Arabia, Serbia, Singapore, Slovakia, Slovenia, South Africa, South Korea, Spain, Sri Lanka, Sweden, Switzerland, Tanzania, Taiwan, Thailand, Turkey, the United Arab Emirates, Uganda, the UK, the U.S., Vietnam and Zimbabwe.
About SAS
SAS is the leader in analytics. Through innovative software and services, SAS empowers and inspires customers around the world to transform data into intelligence. SAS gives you THE POWER TO KNOW®.
Editorial contacts:
- Martin Zorn – Martin.Zorn@sas.com
- Stas Melnikov – Stas.Melnikov@sas.com